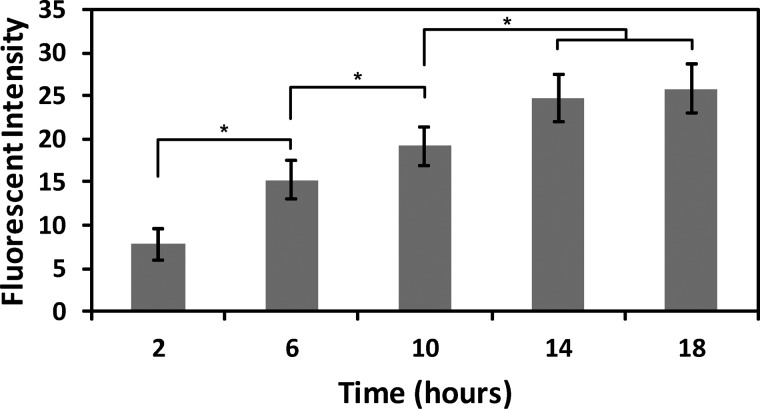
FIG. 6.
Fluorescent expression of HEK cells when incubated with RAW cells and an LPS concentration of 50 ng/mL. The fluorescent intensity of the HEK cells was analyzed every 4 h from 2 to 18 h. Error bars represent the standard deviation calculated from all experiments; experiments were repeated five times resulting in at least 50 cells analyzed for each value. Significant differences are labeled by asterisks (* P < 0.05).

