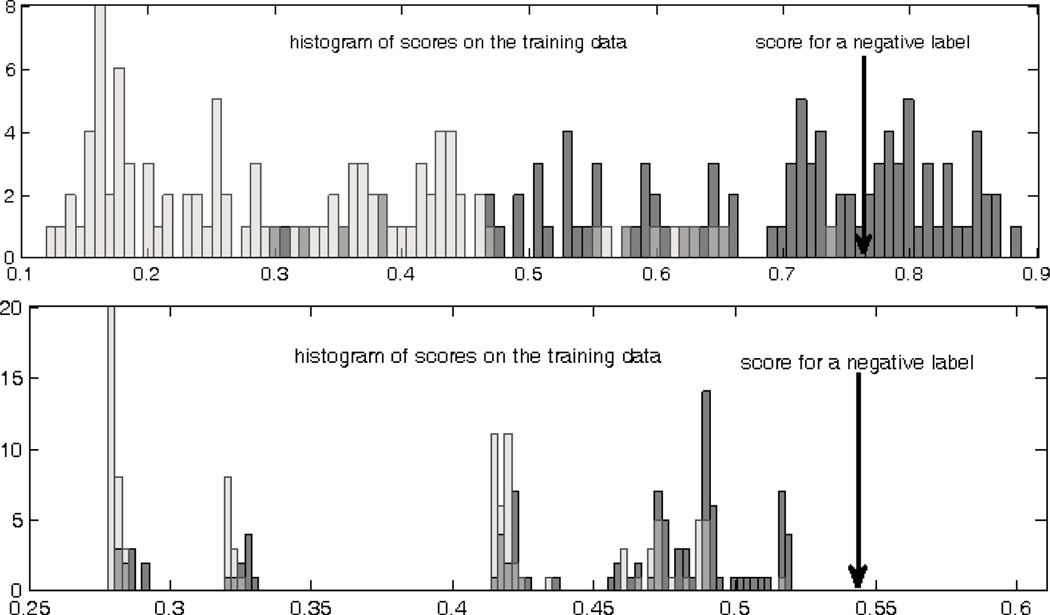
Figure 4.
Histogram of anomaly scores for 2 different tasks. The scores for the top and bottom task range from 0.1 to 0.9 and from 0.25 and 0.61, respectively. The arrow in both cases points to the scores of the evaluated examples, both with negative labels. Despite the score is lower for the bottom task, we may believe that it is more anomalous because it is more extreme within the scores for the same task.

