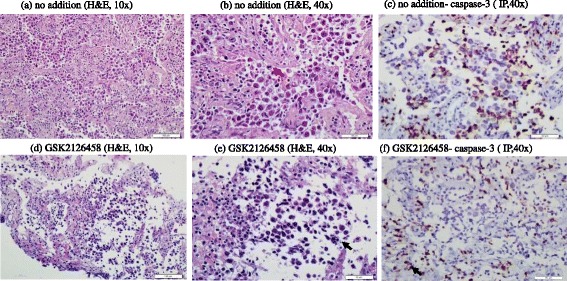
Figure 5.

Ovarian dysgerminoma. (a-f) Histology and expression of caspase-3 by immunoperoxidase in treated and untreated tumor specimens. (a-b) untreated tumor demonstrated nests of neoplastic cells separated by fibrous bands rich in lympho-plasmacytic infiltrate. Mitotic figures are numerous (red arrow), H&E, 10× and 40×, respectively. (d-e) Treated tumor revealing decreased cellular density with cytoplasmic disintegration, vacuolar degeneration, nuclear basophilia, pyknotic nuclei, and numerous apoptotic bodies (black arrow), H&E, 10× and 40×, respectively. (c and f) Expression of caspase-3 in untreated tumor is seen in lymphocytes (black arrow) and some of neoplastic cells. In the treated tumor, there is positivity in residual lymphocytes and lack of positivity in disintegrating pyknotic neoplastic cells, immunoperoxidase (IP), 40×.
