
Figure 5.
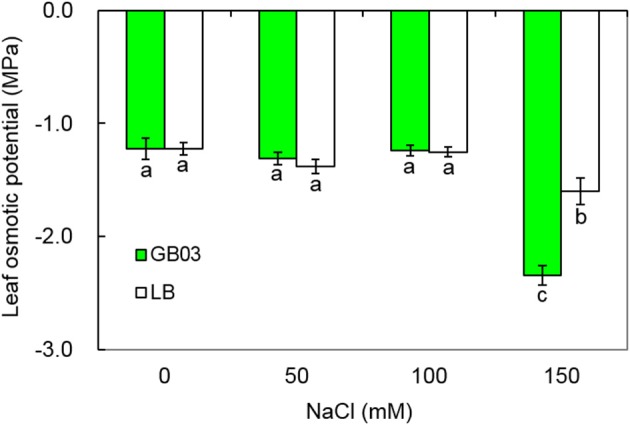
Effects of GB03 bacterization on leaf osmotic potential of white clover under various concentrations of NaCl. Values are means and bars indicate SDs (n = 8). Columns with different letters indicate significant difference at P < 0.05 (Duncan test).