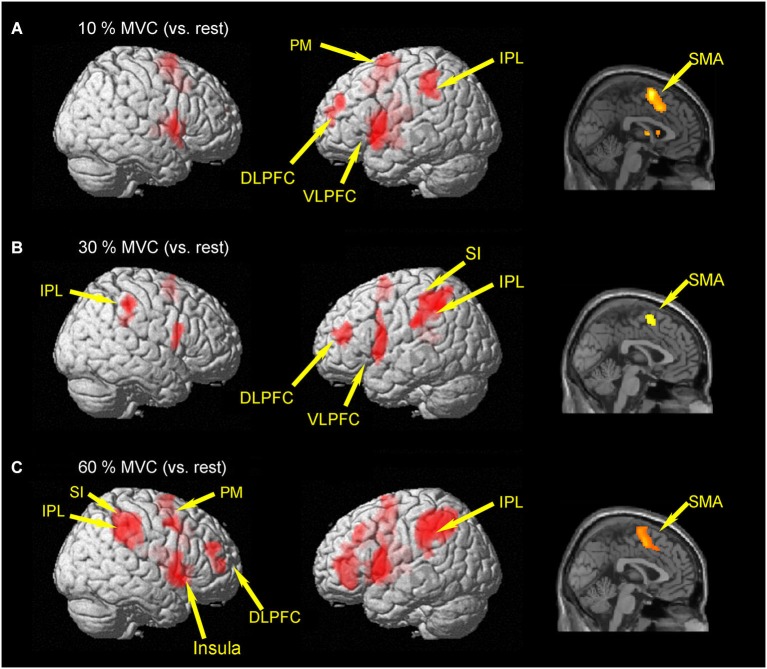
Figure 2.
Group activation map showing activated brain regions in each condition. (A) 10% MVC vs. rest, (B) 30% MVC vs. rest, (C) 60% MVC vs. rest. Using the SPM8 template, areas showing an increase in BOLD-signal are superimposed on a 3D-rendered standard brain. DLPFC = dorsolateral prefrontal cortex; VLPFC = ventrolateral prefrontal cortex; IPL = inferior parietal lobule; PM = premotor area; SMA = supplementary motor area; SI = primary somatosensory cortex.

