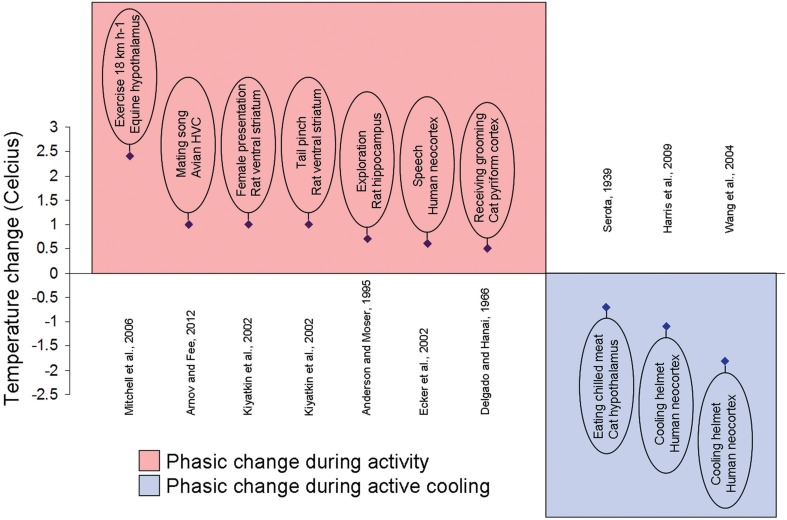
Figure 2.
Local brain temperature change during activity and active cooling. Example studies documenting localized phasic temperature changes after an increase in activity or a stimulus presentation (plotted over red background) or to external cooling (plotted over blue background). Brief experiment description, species, and brain area written inside oval and reference displayed on opposite side of abscissa.

