
Figure 2.
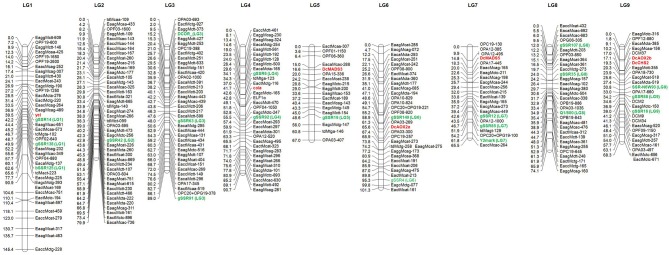
Genetic map of carrot (Daucus carota L.) based on the F2 population DM19. The anchor markers to the carrot reference map (Cavagnaro et al., 2011) are highlighted in green color and designated by the corresponding linkage group number in parenthesis. The newly mapped genes governing flower architecture and pollen development are marked in red. Distances are given on the left of the linkage groups.