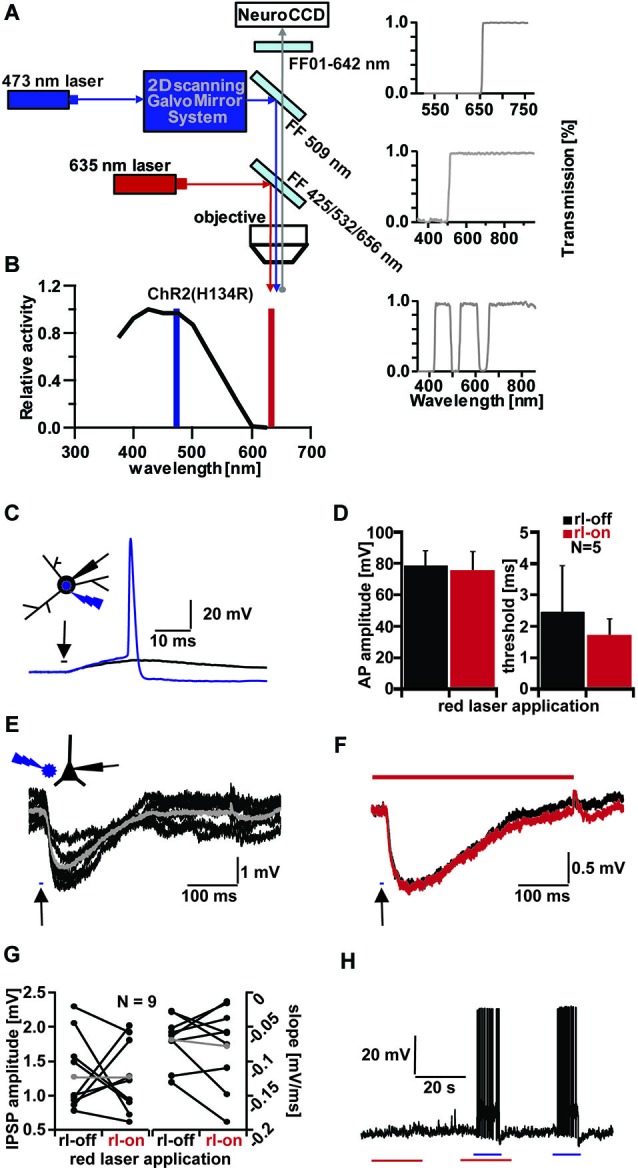
Figure 1.

Channelrhodopsin (ChR) activation and influence of red laser (rl) application. (A) Schematic drawing of optical system for combined VSD imaging and ChR2 activity modulation. (B) ChR2 light excitation spectra (adapted from Gradinaru et al., 2010). Blue line indicates wavelength of 473 nm-laser application, red line indicates 635 nm-laser application. (C) Testing threshold of ChR2+ interneurons activation by increasing light duration (in 0.1 ms increments) applied to soma with below threshold (black trace, 2.5 ms) and above threshold duration (blue trace, 2.6 ms; Vm = −55 mV); inset shows light application configuration on patched Stratum radiatum interneuron. (D) Influence of rl intensity used for VSD imaging on AP amplitude and light duration threshold of five ChR2+ interneurons. Average amplitude (left bar graph): 78.41 ± 9.77 mV (rl-off, black), 75.2 ± 12.21 mV (rl-on, red). Average threshold (right bar graph): 2.46 ± 1.46 ms (rl-off, black), 1.68 ± 0.56 ms (rl-on, red). (E) Evoked IPSPs in a CA1 pyramidal cell by 10 ms blue light application (arrow) next to cell in layer pyramidale (schematic inset). Averaged IPSP (gray; ΔIPSP = 2 mV) of 6 traces (black; Vm = −60 mV). (F) Comparison of evoked IPSPs without (black trace, average of 8) and with rl (red trace, average of 9) application (Vm = −61 mV, ΔIPSP = 1.2 mV). (G) Influence of rl application on IPSP amplitude (left bar graph) and slope (right bar graph) of CA1 pyramidal cells. Average IPSP amplitude (gray): 1.27 ± 0.5 mV (rl-off, left), 2.3 ± 1.99 mV (rl-on, right). Average slope (gray): −0.07 ± 0.04 mV/ms (rl-off, left), −0.18 ± 0.2 mV/ms (rl-on, right). (H) Influence on membrane potential (Vm = −62 mV) of ChR2+ interneuron with red (red line, 20 ms) and blue laser (blue line, 10 ms) application.
