Figure 3.

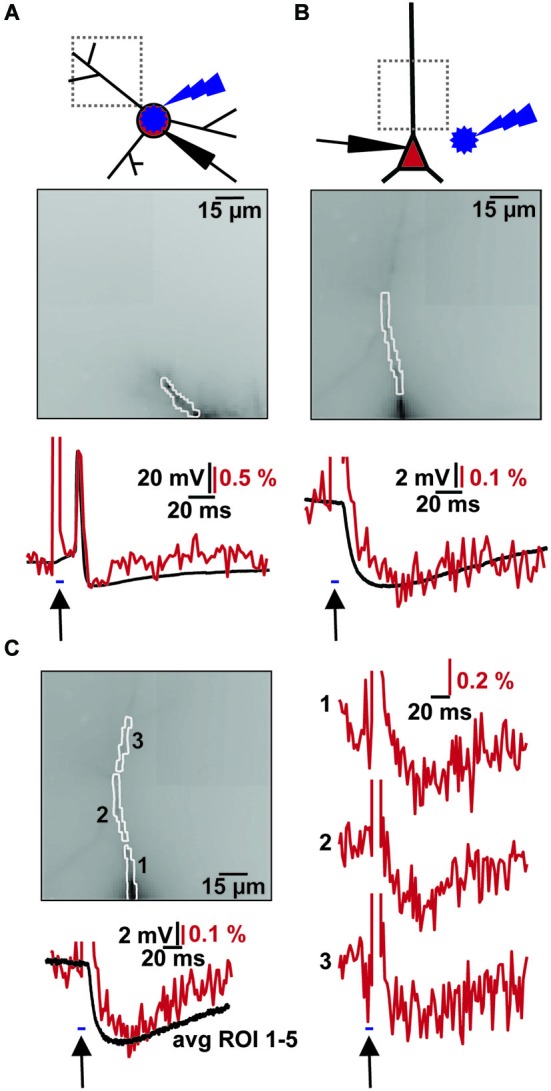
Combined VSD recording with ChR2 activation. (A) Imaging of light evoked AP in ChR2+ interneuron. Top: Schematic illustration of patched ChR2+ interneuron, site of blue flash and imaging region. Middle: Image of filled dendrite with highlighted region of interest (∑ = 54 pixel). Bottom: Simultaneous optical dendritic (red trace, DF/F = 2.1%, average of 2 trials) and electrical somatic (black trace, ΔV = 73.4 mV; Vm = −40 mV) recording. Arrow indicates blue light application (2 ms). (B) Imaging of induced IPSP in CA1 pyramidal cell. Top: Schematic illustration of patched cell, site of blue flash and imaging region. Middle: Image of filled apical dendrite with highlighted region of interest (∑ = 34 pixel). Bottom: Simultaneous optical dendritic (red trace, DF/F (IPSP) = 0.4%, average of 10 trials) and electrical somatic (black trace, ΔV (IPSP) = 4.9 mV; Vm = −60.1 mV) recording. Arrow indicates blue light application (5 ms). (C) High resolution optical recording after blue light stimulation. Left top: Image of filled apical dendrite with highlighted ROIs (1–3, average of 6 trials). Left bottom: Simultaneous optical dendritic (red trace, ∑ = 130 pixels, DF/F (IPSP) = 0.3%) and electrical somatic (black trace, ΔV (IPSP) = 5.9 mV; Vm = −59.8 mV) recording. Right: Optical dendritic recordings of evoked IPSP patterns in the marked ROIs. Arrow indicates blue light application (5 ms).
