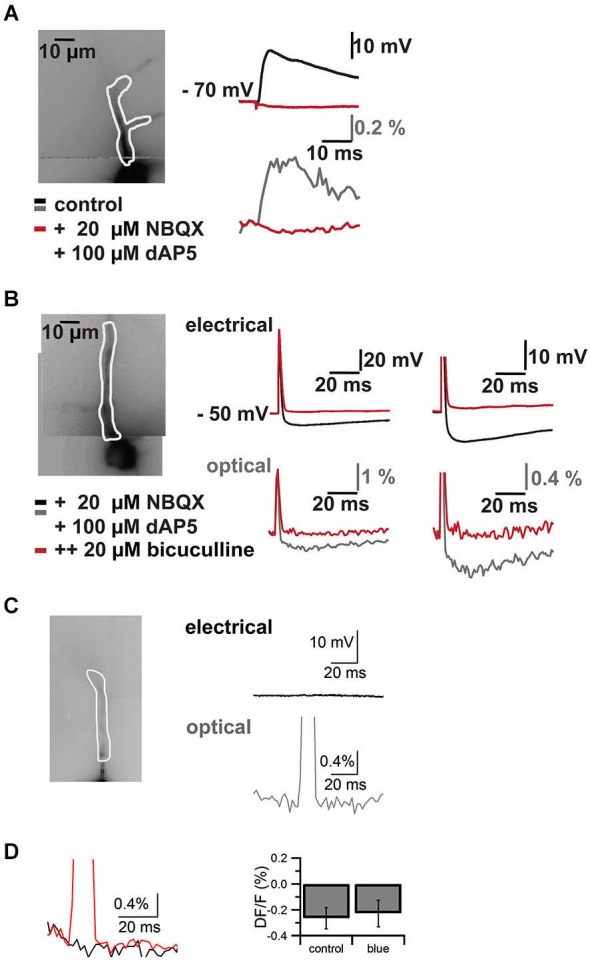
Figure 4.

Control experiments. Pharmacological block of synaptic signals in cells filled with VSD and blue laser artifact in the absence of an electrical response. Responses are recorded both with somatic patch clamp electrodes (top traces in mV) and by VSD imaging (bottom traces in% DF/F). (A) Imaged neuron with ROI on apical dendrite shown in white outline on the left. On the right EPSP through the somatic patch clamp electrode top and VSD imaging in the region of interest bottom. Black/gray traces are baseline, red traces are after addition of the NMDA and AMPA receptors AP5 and NBQX respectively. (B) Imaged neuron with region of interest on apical dendrite in white outline on the left. A stimulus electrode was placed near the soma of the neuron to evoke an action potential and an inhibitory postsynaptic potential (excitatory synaptic transmission was blocked with AP5 and NBQX). Traces on the right show electrode recordings on top and VSD imaging at bottom at lower (left) and higher resolution (right). Black/gray are baseline traces, red traces are after application of the GABA(A) receptor antagonist bicuculline. Note that the action potential is preserved and faithfully recorded by VSD, while the inhibitory synaptic signal is completely blocked by the GABA(A) receptor antagonist. I four such cells we could completely block synaptic signals with a combination of AP5, NBQX and bicuculline. (C) Imaged neuron with region of interest overlaid on the left. Electrical recording (top, black) and optical recording (bottom, gray) from a CA1 pyramidal neuron. The focused laser beam failed to hit ChR2 expressing structures and thus failed to elicit a response. A square pulse artifact can be observed in the optical trace. (D) Left, overlay of trace without laser stimulation (black) and with laser stimulation (red) in the absence of a synaptic response. The decay in the response is due to dye bleaching, which was not compensated in this case. To quantify the effect of the blue laser pulse in the absence of synaptic responses, we measured the difference between two 5 ms epochs, one 5 ms before the pulse and one directly following the laser pulse. We compared control trials (DF/F −0.27 ± 0.08%) without laser pulse and trials with laser pulses (DF/F −0.23 ± 0.13%) (N = 4, p > 0.8).
