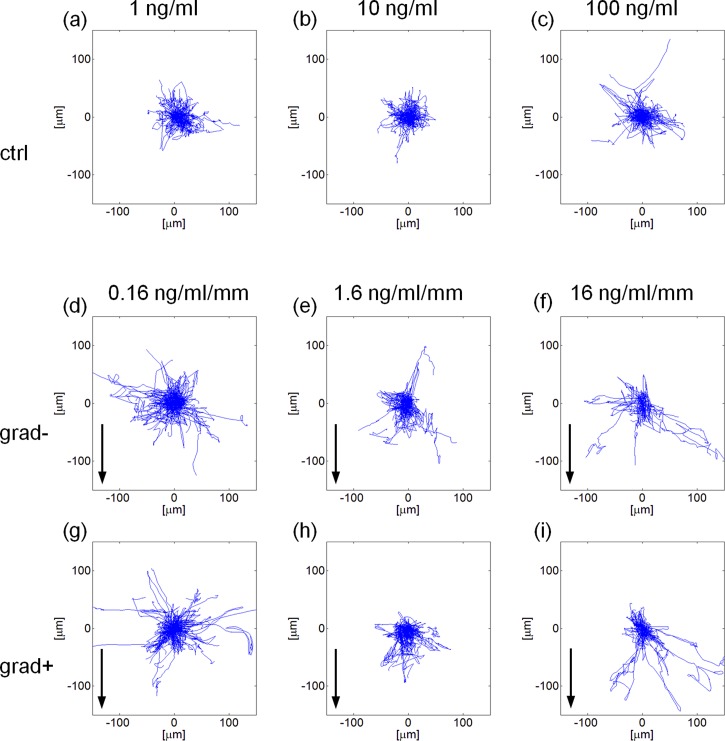
FIG. 7.
Windrose plots of the trajectories described in case of a uniform concentration of BMP-2 (a)–(c) or in presence of a gradient thereof (d)–(i). BMP-2 source is at the bottom of the plots and arrows indicate the gradient direction. The terms grad− or grad+ refer to cells closer to the factor sink or source, respectively. Each plot refers to a 300 × 300 μm area.

