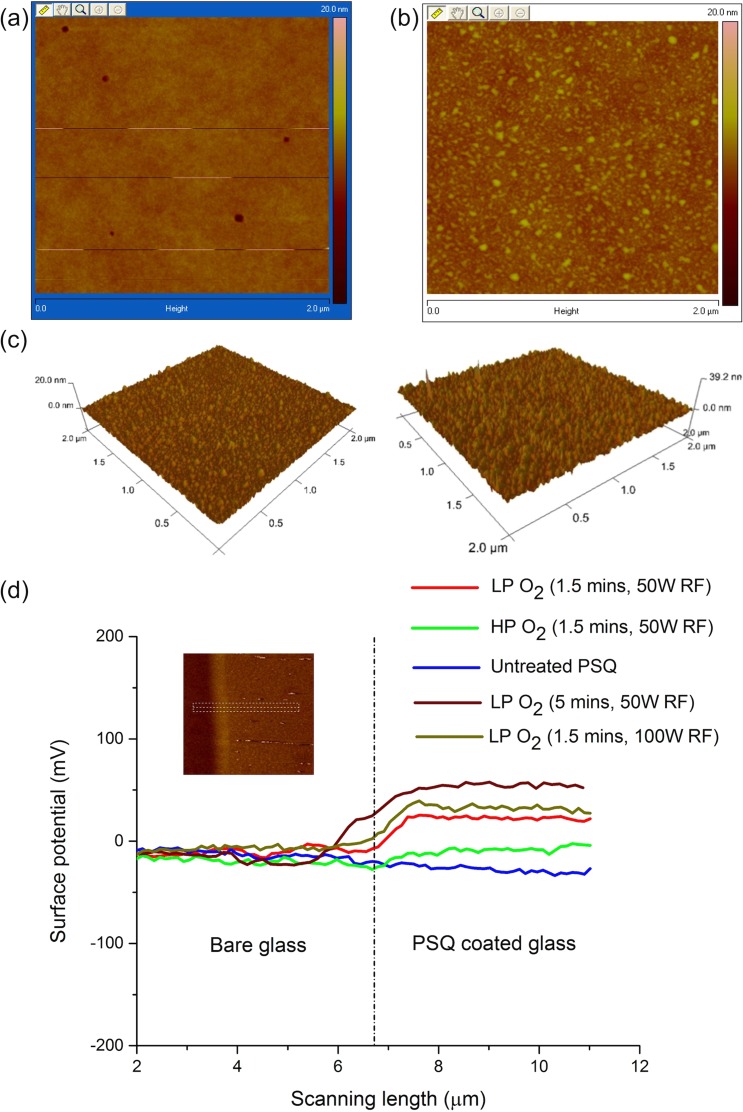
FIG. 1.
AFM profile of (a) HP (0.2 mbar pressure) and (b) LP (0.02 mbar pressure) O2 plasma treated PSQ surface. Both were processed with 20 sccm O2, 50 W RF power, and 1.5 min exposure. (c) Comparison of LP O2 plasma treated PSQ surfaces for different RF powers: 50 W (left) and 100 W (right), showing roughness of 0.7 ± 0.1 nm (with ∼5 nm crests) and 1.8 ± 0.2 nm (with ∼10 nm crests), respectively (see supplementary Fig. S2).29 (d) KPFM measurements of LP and HP O2 plasma treated and untreated PSQ surfaces. PSQ was coated on one half of a coverslide for measurements. Inset shows representative image obtained during surface potential measurements.

