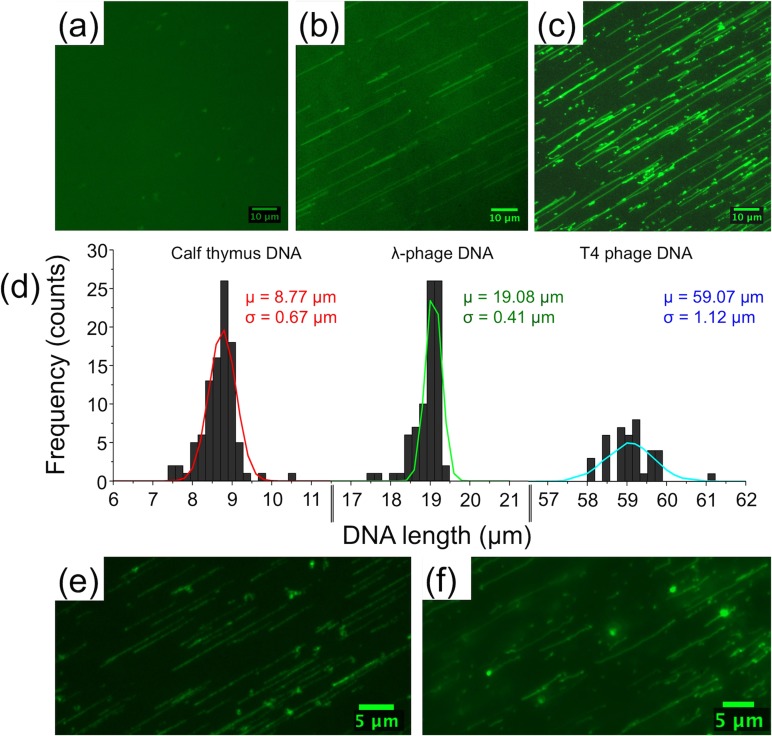
FIG. 3.
T4 DNA molecules in microchannel bonded with LP O2 plasma treated PSQ (1.5 min): (a) immediately after being driven from the reservoirs, (b) 5–10 min after applying a constant applied electric field (2.5 V/cm), T4 DNA molecules show one end immobilization and stretching, and (c) after 20–30 min, more DNA molecules get combed on the PSQ surface. (d) Gaussian fitted histogram plot showing the length distribution of calf thymus (mean length μ = 8.77 μm, standard deviation σ = 0.67 μm), λ-phage (μ = 19.08 μm and σ = 0.41 μm), and T4 phage (μ = 59.07 μm and σ = 1.12 μm) in microchannel bonded with LP O2 plasma treated PSQ. λ-phage DNA immobilized at (e) both ends in 3-min LP O2 plasma treated PSQ and (f) multiple points in 5-min LP O2 plasma treated PSQ. (Multimedia view) [URL: http://dx.doi.org/10.1063/1.4892515.1]

