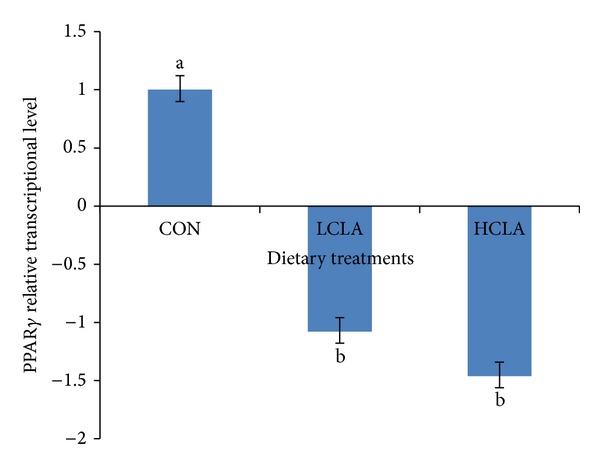
Figure 2.

Comparison of PPARγ relative transcriptional level in the abdominal fat of chickens fed diets with CON, LCLA, and HCLA. Values were normalized with reference genes, β-actin, and GAPDH. Then, treated samples were expressed relative to transcriptional level of CON group. Values are mean ±1 standard error (n = 10). CON: without CLA; LCLA: low CLA; HCLA: high CLA. Letter in superscript indicated a significant difference compared with the CON group (P < 0.05).
