
Figure 5.
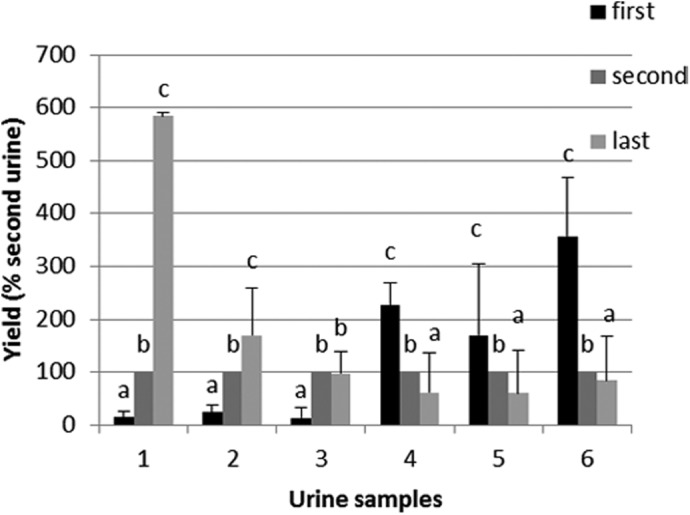
Sampling time: comparison of yield of human DNA obtained from 1 ml second morning urine with the first morning urine and the afternoon urine (“last”). Female urine samples: 1–3; male urine samples: 4–6. Different letters indicate statistically different results (α=0.05), analyzed/individual. Error bars represent the sd to the mean for four extractions (n=4).