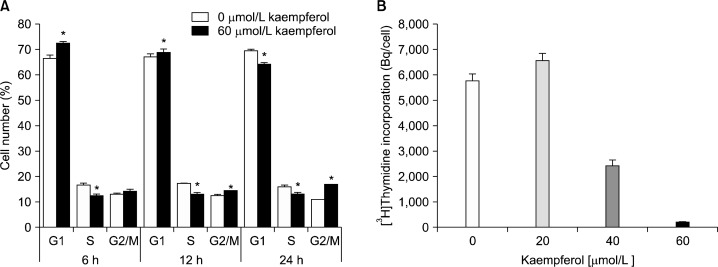
Fig. 2.
Kaempferol suppresses the cell cycle progression in HT-29 cells. (A) Cells were treated with 0 or 60 μmol/L kaempferol for 6, 12, or 24 h. Cells were trypsinized, fixed, and treated with RNase. Cellular DNA was then stained with propidium iodide. The percentages of cells in G1, S, and G2/M phases of the cell cycle were analyzed by flow cytometry. * indicates significantly different from the control group (0 μmol/L Kaempferol), P<0.05. (B) Cells were treated with various concentrations of kaempferol for 21 h. [3H]Thymidine was added and the incubation was continued for another 3 h to measure the incorporation into DNA. Each bar represents the mean±SEM (n=6). Means with different letters are significantly different, P<0.05.

