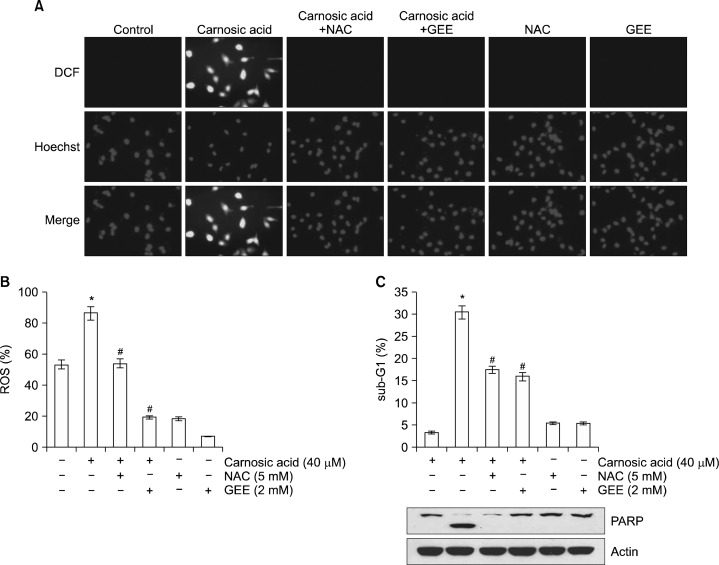
Figure 2.
Production of ROS is associated with carnosic acid-induced apoptosis. (A and B) Caki cells were pretreated with 5 mM NAC and 2 mM GEE for 30 minutes, and then added with 40 μM carnosic acid for 30 minutes. Cells were stained with the fluorescent dye 2’, 7’-dichlorodihydrofluorescein diacetate (H2DCFDA) and Hoechast 33342 for an additional 10 minutes. Fluorescence was immediately assayed by fluorescence microscope (A) or by flow cytometry (B). (C) Caki cells were pretreated with 5 mM and 2 mM GEE for 30 minutes, and then treated with 40 μM carnosic acid for 24 hours. The level of apoptosis was measured by the sub-diploid DNA content, sub-G1 fraction using flow cytometry. The protein expression levels of poly (ADP-ribose) polymerase (PARP) and actin were determined by Western blotting. The level of actin was used as a loading control. The values in (B and C) represent the mean ± SD from three independent samples. *P < 0.01 compared to the control. #P < 0.01 compared to the carnosic acid. DCF, H2DCFDA.

