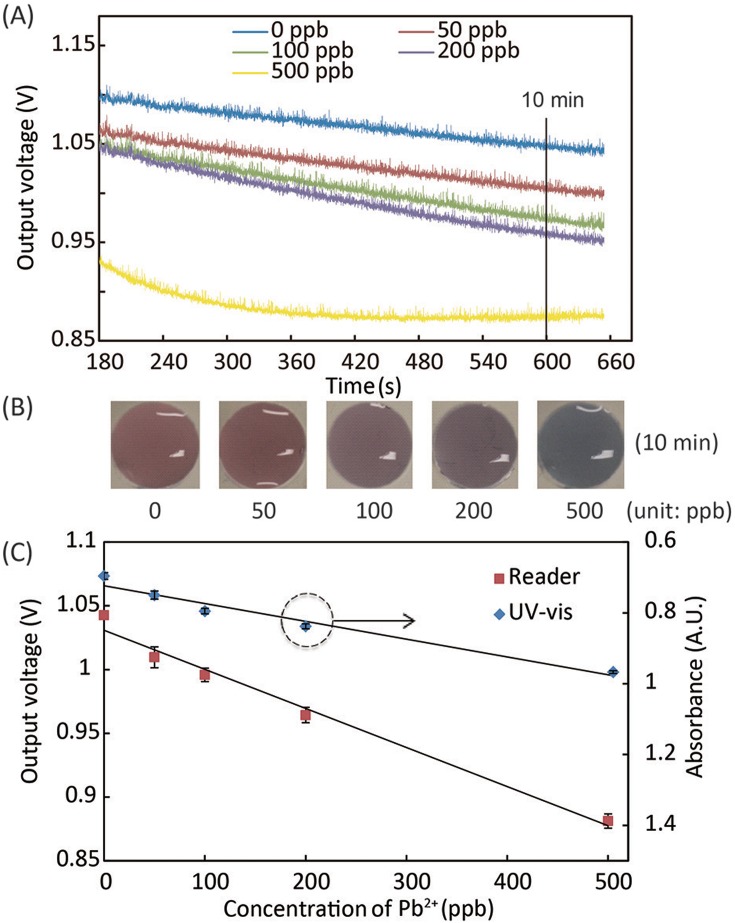
FIG. 5.
Experimental results of the Pb2+ assay. (A) The kinetic curve of AuNP aggregation in Pb2+ solutions in terms of light absorbance at 610 nm. (B) Photographs of assay solutions at different Pb2+ concentrations, which generated different levels of color change after 10-min reaction. (C) Calibration curves of the Pb2+ assay, obtained using the portable reader and UV-vis spectrometer,25 with linear regression equations of y = −0.00031x + 1.0 and y = 0.00050x + 0.72, for data from the portable reader and UV-Vis spectrometer, respectively.

