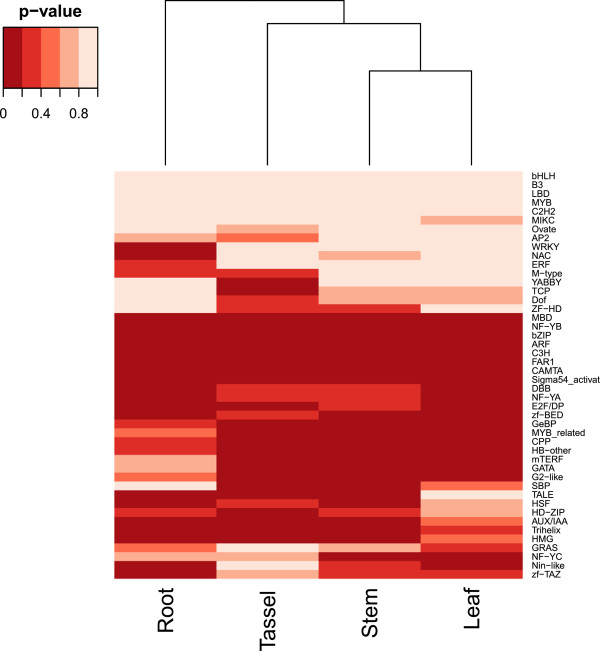
Figure 5.

Clustering of enrichment pattern of expressed TF and TC genes in different tissues in millet. Each cell in the figure indicates the significance level (in terms of p-value) of a TF family in a tissue group as indicated in Table 6. The dendrogram depicted the similarity of enrichment pattern among different tissue groups.
