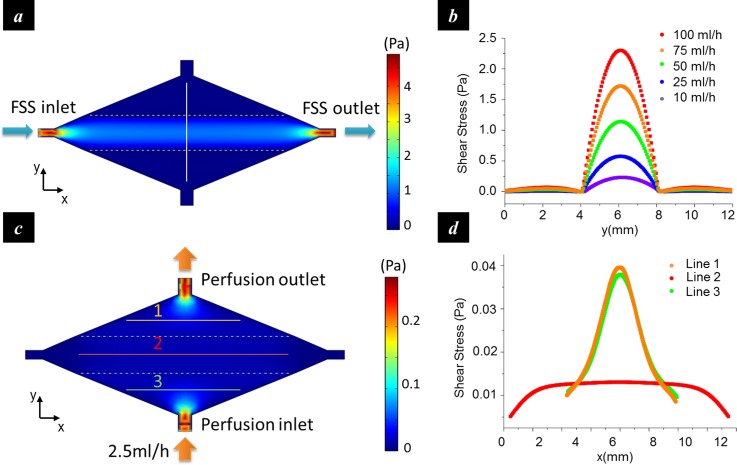
FIG. 4.
Numerical analysis of the shear stress distribution. (a) Shear stress distribution in the FSS mode; (b) shear stress profiles along the vertical line in (a) at different inlet flow rates. The shear stress in the center compartment was much greater than those in the side compartments, especially at high flow rates; (c) shear stress distribution in the perfusion mode; and (d) shear stress profiles along the marked lines in (c).

