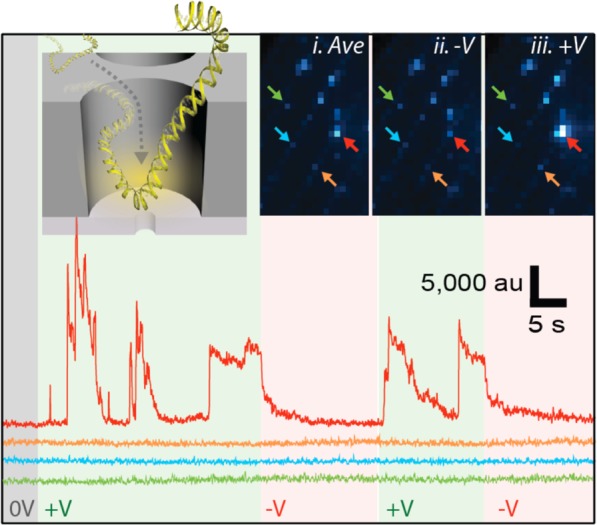
Figure 5.

DNA focusing into a NZMW. Fluorescence time traces from a single NZMW that contains a 3 nm diameter pore in an array of ZMWs is monitored for the fluorescence from 6000 bp DNA labeled with YOYO-1 (9 pixel region of interest for each NZMW, 10.8 ms exposure time, signal-averaged to 100 ms). Inset illustrates DNA entering the illumination volume of a NZMW as it migrates toward the pore, resulting in increased ZMW fluorescence. ZMW arrays are shown in fluorescence images (i)–(iii) with (i) being an averaged image of all frames in the experiment, and (ii) and (iii) being the membrane under respective −850 and 850 mV. Colored arrows identify ZMWs with corresponding colored fluorescence traces in bottom plot. The red arrow identifies a NZMW. Green and red backgrounds in the fluorescence traces correspond to periods of positive and negative voltage, respectively (see Supporting Information for electrical trace).
