Figure 5.
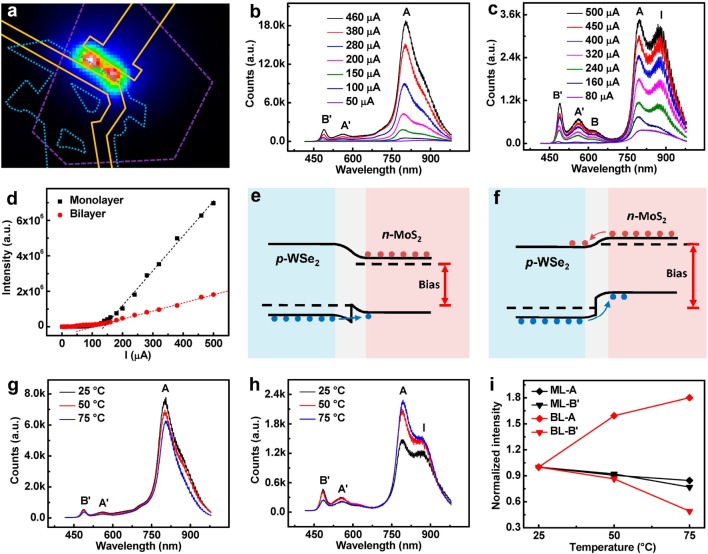
Electroluminescence (EL) from the WSe2/MoS2 heterojunction p–n diode. (a) The false color EL image of the heterojunction device under an injection current of 100 μA. The purple dashed line outlines the ML-WSe2, the blue dotted line outlines the MoS2 and the golden solid line outlines the gold electrodes. (b) The EL spectra of a ML-WSe2/MoS2 heterojunction at different injection current. (c) The EL spectra of a BL-WSe2/MoS2 heterojunction at different injection current. (d) The EL intensity as a function of injection current for both ML- and BL-WSe2/MoS2 heterojunction. (e) The ideal band diagram of the WSe2/MoS2 heterojunction under small forward bias. The conduction band in MoS2 is below that in WSe2, the valence band in WSe2 is below that in MoS2. At small bias, holes can go cross the junction and inject into n-type region, while the electrons cannot go cross the junction. (f) The ideal band diagram of the WSe2/MoS2 heterojunction under large forward bias. The conduction band in MoS2 shifts upward and is higher than that in WSe2, and the valence band in WSe2 is below it in MoS2. At large bias, both electrons and holes can go cross the junction and inject into the other side of the heterojunction. (g) The EL spectra of a ML-WSe2/MoS2 heterojunction at different temperature ranging from 25 to 75 °C. (h) The EL spectra of a BL-WSe2/MoS2 heterojunction at different temperature ranging from 25 to 75 °C. The injection current is fixed at 250 μA. (i) The normalized intensities of A and B′ peaks in the EL spectra of both ML- and BL-WSe2 as a function of temperature.

