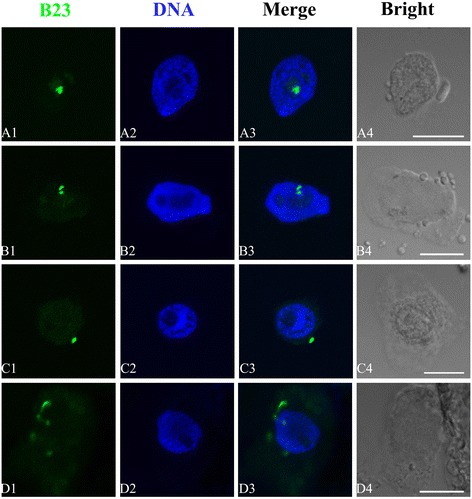
Figure 8.

Effects of different concentrations of Al on the translocation of B23. Simultaneous location of B23 after the reaction with primary anti-B23 antibody and secondary antibody conjugated with FITC (green) and DNA after the reaction with DAPI (blue) in the same single optical section obtained with the confocal scanning laser microscopy. A1–D1, B23 detection; A2–D2, DNA detection; A3–D3, Merged image; A4–D4, Bright field image of the cells. A1–A3, B23 was localized in nucleolus in control cells. B1-B3, Showing that B23 was migrated from nucleolus to nucleoplasm in the cells exposed to10−4 M Al for 72 h. C–D, Showing that B23 was scattered in cytoplasm of the cells exposed to 10−2 M Al for 72 h and the intensity of B23 signals increased in cytoplasm. Scale bar =10 μm.
