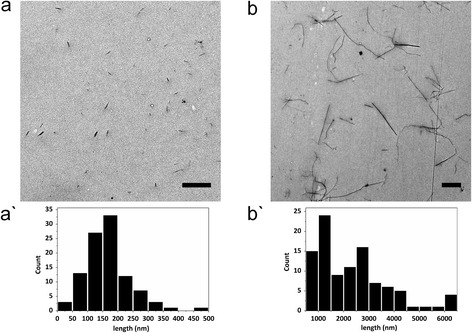
Figure 1.

Morphology of CNCs in stock suspension. Transmission electron microscopy images of c-CNCs (a) and t-CNCs (b) after dispersion in ultrapure water. Histograms show the size distribution as counts (y-axis) and length (nm) (x-axis) of c-CNCs (a`) and t-CNCs (b`). Scale bars represent 1 μm. Dimensions were derived from 100 individual measurements of 3 individual nebulisations (n = 3).
