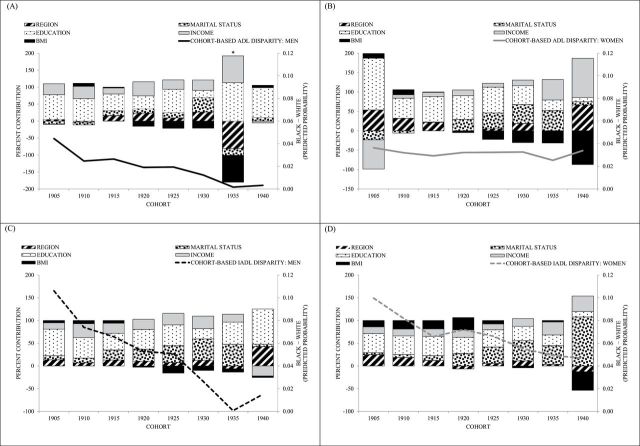
Figure 5.
Sociodemographic contributions to the cohort-based ADL and IADL disparity trends among men and women: (A) contributions to black–white disparity in ADL disability: men, (B) contributions to black–white disparity in ADL disability: women, (C) contributions to black–white disparity in IADL disability: men, and (D) contributions to black–white disparity in IADL disability: women. ADL = activities of daily living; IADL = instrumental activities of daily living. *The actual percent contributions of education and region for ADL disparity among men in 1935 cohort do not match with what were shown in the figure. The percent contribution for education (283.6%) and region (−163.1%) for cohort 1935 among men were very large, thus, the contributions for these two covariates were re-scaled in cohort 1935 to improve the readability of Figure 5A.

