
Figure 2.
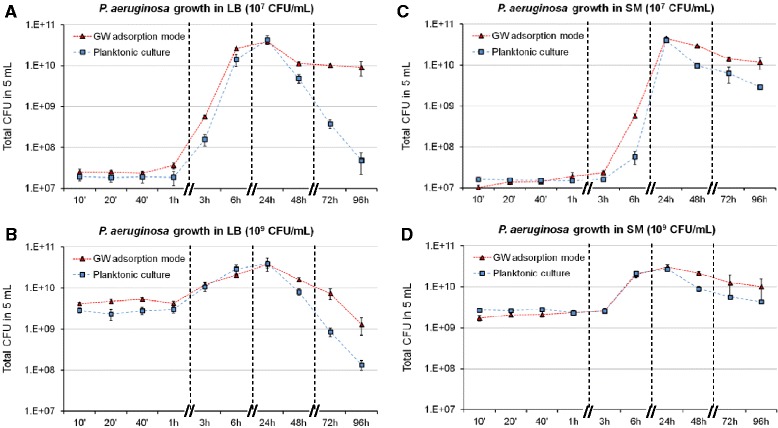
Total CFU over time in adsorption mode (GW) versus planktonic culture. The LB (A,B) or SM (C,D) cultures were inoculated at 107 (A,C) or 109 (B,D) CFU/mL. One g of GW was inoculated with 5 mL of medium. After incubation, total CFU (planktonic and sessile cells) on GW were compared to CFU contained in 5 mL of planktonic culture. Each point is the mean ± SD of biological triplicates. A non-linear time scale was chosen and dotted lines were drawn between experimental points for the sake of clarity.