Figure 3.

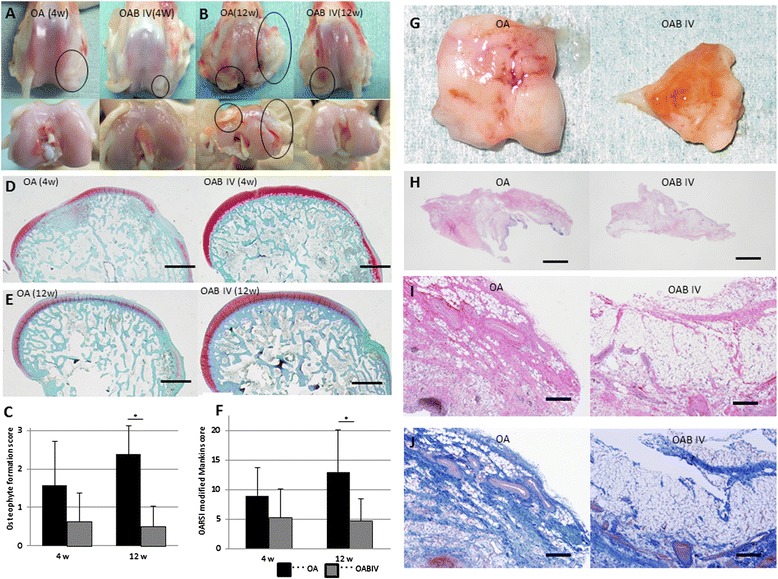
Comparison of macroscopic and histological evaluations between the osteoarthritis (OA) and intravenous administration of bevacizumab in OA (OAB IV) rabbits (experiment 2). (A) Macroscopic articular cartilage appearance 4 weeks after anterior cruciate ligament transection (ACLT). (B) Macroscopic appearance 12 weeks after ACLT. Circles indicate osteophyte formation. (C) Osteophyte formation scores 4 and 12 weeks after ACLT. Data are expressed as mean ± SD (n = 8 knees). Safranin O staining of hyaline cartilage 4 weeks (D) and 12 weeks (E) after ACLT. (F) Osteoarthritis Research Society International histological score 4 and 12 weeks after ACLT. (G) Macroscopic synovia appearance 4 weeks after ACLT. (H) Representative synovial histology for OA group (left side) and OAB IV group (right side) stained with H&E. Higher magnifications of the image shown in (H) stained with HE (I) and Masson trichrome (J). Data are expressed as mean ± SD (n = 8 knees). *P <0.05 by the Mann-Whitney U-test. Bars = 1 mm (D, E, H); bars = 300 μm (I, J).
