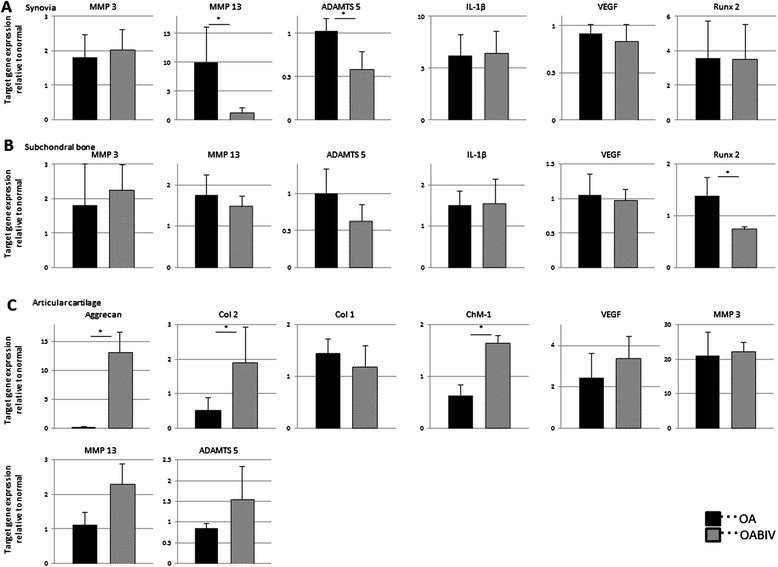
Figure 4.

Comparison of relative gene expression levels between the osteoarthritis (OA) and intravenous administration of bevacizumab in OA (OAB IV) groups (experiment 2). (A) Synovial gene expression. (B) Subchondral bone gene expression. (C) Articular cartilage gene expression. The y-axis is defined as follows: 2–ΔCT OA or OAB IV target gene/2–ΔCT normal target gene. The normal tissue is represented as 1 on the y-axis. Data are expressed as mean ± SD (n = 4 knees). *P <0.05 by the Mann-Whitney U-test.
