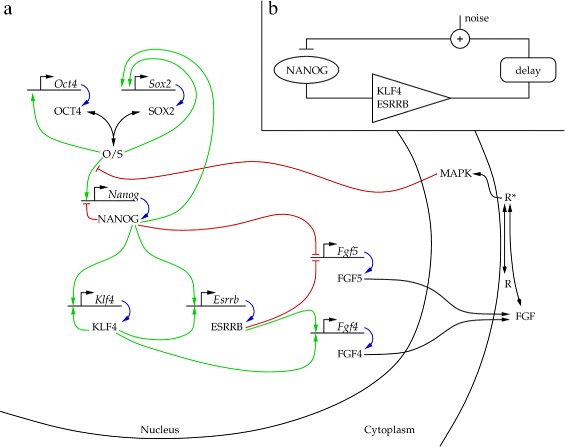
Figure 5.

The signaling and transcriptional network considered to regulate mouse ES cell maintenance. (a) Full model. Green, red and blue arrows represent transcriptional activation, repression and translation, respectively. Black arrows represent complex formation, and various multi-step processes: (i) FGF secretion resulting in an effective autocrine ligand concentration and (ii) activation of the MAPK. (b) Schematic representation of the autocrine feedback loop. The suggested model acts as a noisy negative feedback regulator which includes a signal amplifier and delay.
