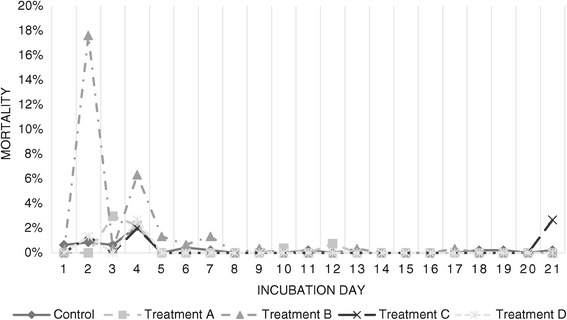
Figure 6.

Mortality distribution for each treatment according to incubation period. Mortality curves for each treatment throughout 20 days of incubation. Values are displayed as percentage of embryos dead at each day of incubation (time of death established by visual inspection of the embryo and comparison with normal embryos) per total of fertile eggs incubated.
