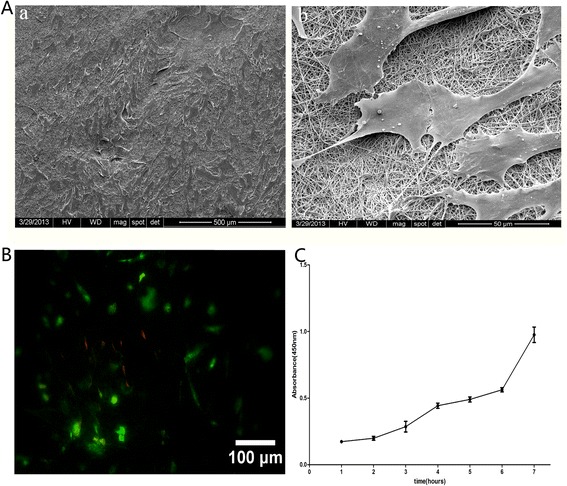
Figure 3.

The biocompatibility of PCL/GT membranes. A. SEM images of USCs on PCL/GT on day 7, a: low magnification, b: high magnification; B. The viability of USCs, as analyzed using a live/dead assay in which calcein green indicates live cells; C. USCs showed robust proliferation on PCL/GT. Scale bar A (a) = 500 μm; A (b) = 50 μm; B = 100 μm.
