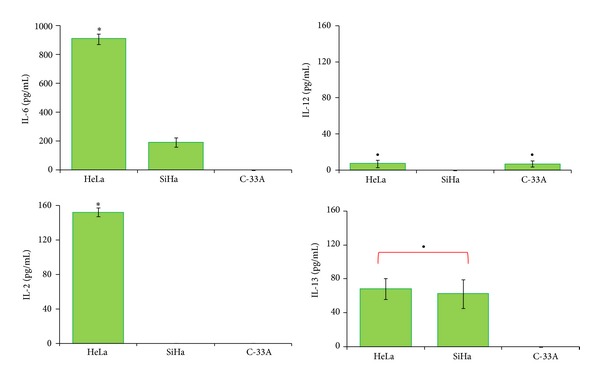
Figure 2.

Cytokine profile production in HeLa, SiHa, and C-33A cervical cancer (CC) cells. CC cell lines were cultured in flask at 80–90% confluence and harvested, and subsequently 100,000 cells were plated on 6-well culture plates and cultured for 5 days. Supernatant was collected and concentration of cytokines was determined by flow cytometry (FC) using a cytometric bead array (CBA) kit. The results represent the mean ± standard deviation (SD) of concentrations in pg/mL for each cytokine. Statistical analysis, Student's t-test. *P < 0.0001 HeLa versus SiHa and C-33A groups; • P < 0.05 HeLa and SiHa versus C-33A group, or HeLa and C-33A versus SiHa group.
