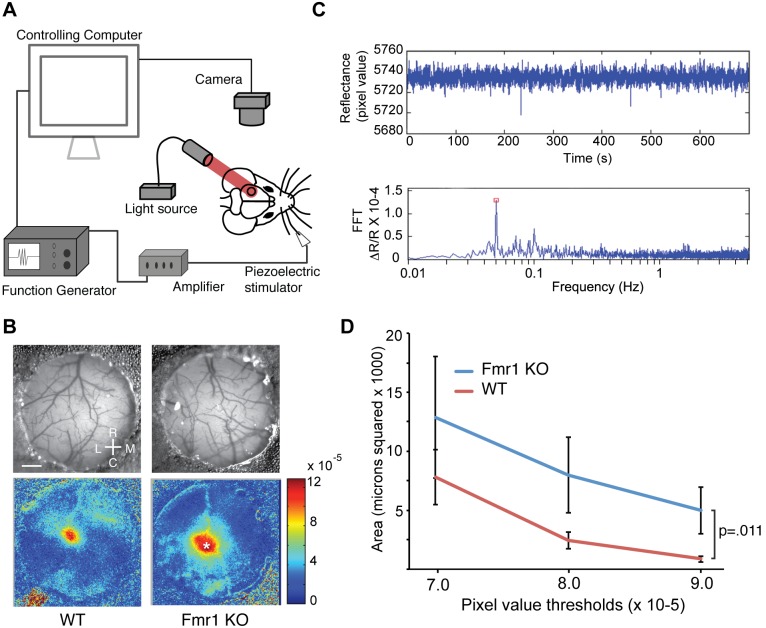
Figure 1. Fmr1 KO mice exhibit increased evoked activity in primary somatosensory cortex during whisker stimulation.
(A) Schematic showing experimental set up of intrinsic optical imaging over primary somatosensory cortex (black circle) during periodic whisker stimulation. (B) Pictures of the thin skull preparation and example images collected from a wild-type (WT) mouse (left) and Fmr1 KO mouse (right) mouse. Scale bar = 0.4 mm. Rostral (R), Caudal (C), Lateral (L) and Medial (M) coordinates are shown. (C) Representative examples of data collected during a typical imaging session. Above, a time series of pixel values for the cortical location indicated by the asterisk in the Fmr1 KO in panel B. Below, a fast-fourier transform (FFT) of the raw trace extracts the magnitude of the change in reflectance (ΔR/R) corresponding to the frequency of whisker stimulation (red square). (D) The number of pixels within the region of response with ΔR/R magnitudes greater than the threshold indicated on the abscissa for WT (n = 10) and Fmr1 KO (n = 10) mice. The response to whisker stimulation is elevated in Fmr1 KO mice (WT vs. KO, p = .011; 2-way ANOVA).

