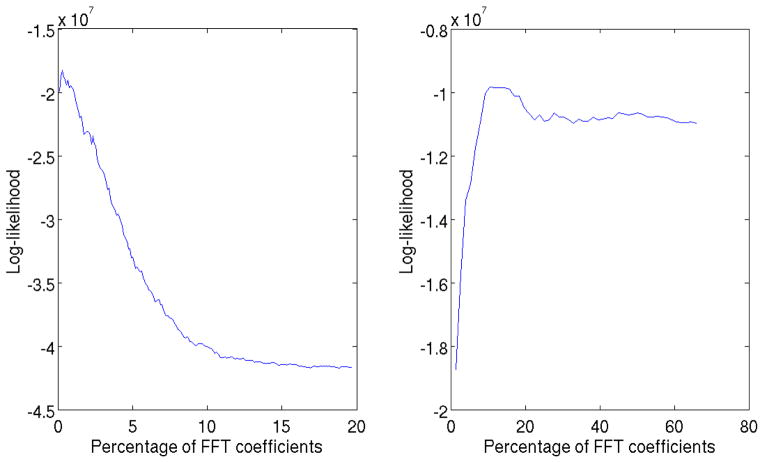
Figure 3.
Likelihood score as a function of C for different SNR. Left: likelihood estimated from 300 aligned subtomograms from the real data described in materials and methods where SNR is very low. C* is very small. Right: likelihood estimated from 150 aligned subtomograms from the phantom described in section 4 with SNR = 10. C* is analogous to selecting all the non-zero coefficients according to Fig. 1.

