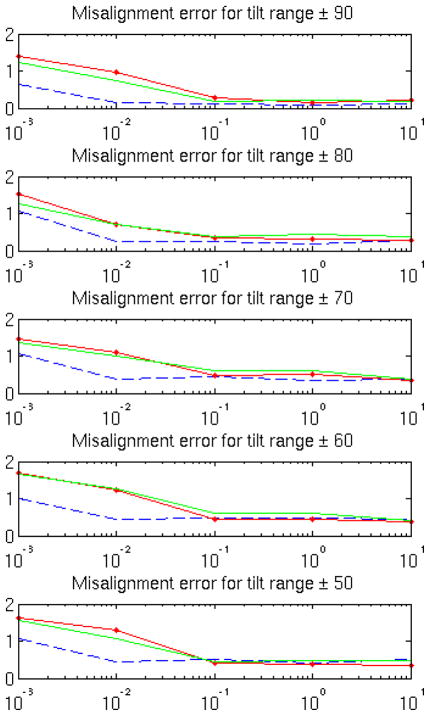
Figure 5.
RMSE alignment comparison between three different metrics for synthetic data: TCCC (dashed blue), constrained cross-correlation from Forster et al. (2008) (dot-continuous red) and eq. (2) from Bartesaghi et al. (2008) (continuous green). Results are obtained at different SNR and tilt range levels.

