
Figure 4. Subcellular distribution of NADH in mammalian cells.
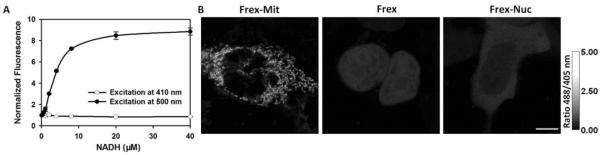
(A) Fluorescence intensities with excitation at 410 nm or 500 nm normalized to the initial value; emission at 528 nm. (B) Ratiometric fluorescence images of cells expressing Frex in mitochondria, the nucleus, and cytosol. The pixel-by-pixel ratios of the 488 nm excitation image by the 405 nm excitation image of the same cell were used to gray the images. Scale bar, 10 μm.