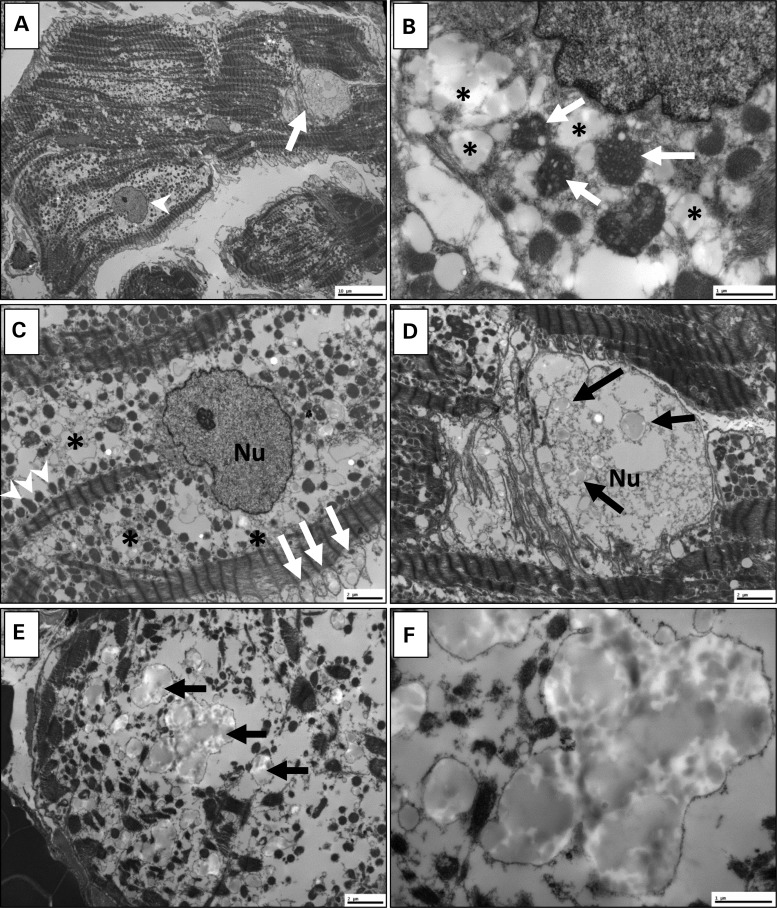
Figure 6.
Transmission electron microscopy of ventricular tissue. Ultrastructure of ventricular myocardium was determined for individual III.4. (A) At scanning magnification, non-specific mitochondriosis (increased number of mitochondria) is apparent with variable loss of myofilaments. Some nuclei are normal (arrowhead); others are abnormal (arrow). (B) Some mitochondria (arrows) show architectural disorganization of cristae with vacuolization and degenerative changes, and are surrounded by sarcoplasmic inclusions (*). (C) The sarcoplasm contains many severely swollen mitochondria (arrows), as well as scattered preserved mitochondria (arrowheads) within extensive zones (*) of complete mitochondrial disruption. In this cardiomyocyte, the nucleus (Nu) is intact. (D) Other nuclei are abnormal, containing numerous amorphous intranuclear inclusions (arrows). (E) Similar inclusions (arrows) are present in the sarcoplasm, particularly in areas of marked myofilament loss. (F) At higher magnification, inclusions are amorphous, globular and electron-opaque. Some appear to be membrane-bound, possibly representing distended mitochondria or lysozomes. Scale bar: 10 µm (A); 2 µm (C–E); 1 µm (B and F).

