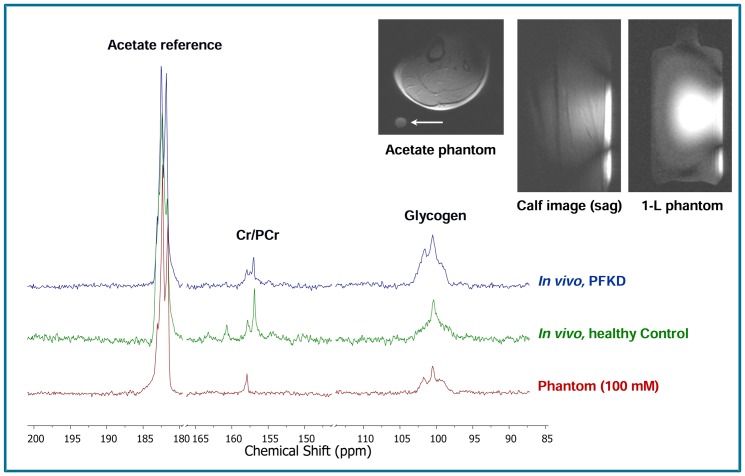
Figure 1. 13C MRS spectra of glycogen and creatine (Cr)/phosphocreatine (PCr) in calf muscle showing glycogen accumulation in a patient with muscle phosphofructokinase deficiency (PFKD) compared with a healthy control subject and the reference quantification phantom at 7T.
The observed doublet for the acetate reference is due to the C1-C2 coupling. An axial image of the calf showing the internal acetate phantom (white arrow). Sagittal images of the calf and the 1-L external calibration phantom show the similar approximate sensitivity of the coil.

