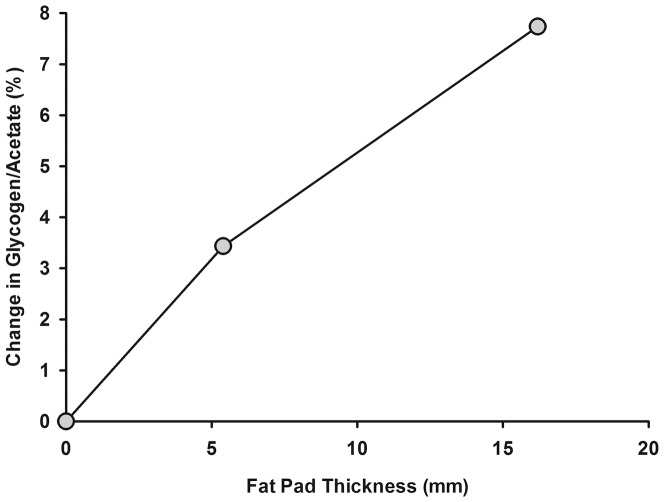
Figure 2. Correction factors for the glycogen/acetate ratio as a function of the thickness of the fat layer underneath the calibration phantom.
All in vivo data were corrected for the measured thickness of the subcutaneous fat by using interpolated values from this figure. For most subjects this correction was in the order of 4−5%.

