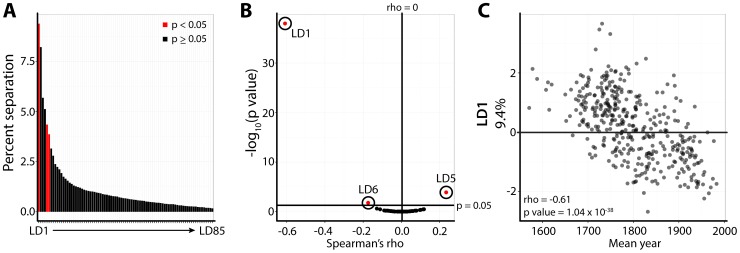
Figure 4. Linear discriminants of luthier correlated with time.
A) Percent separation contributed by linear discriminants (LDs) 1–85, separating violin outlines by luthier. Averaged LDs by luthier were correlated with the mean year of manufacture for luthiers. Those LDs significantly correlated with time are indicated in red. B) Scatterplot of Spearman's rho (x-axis) and -log10 p-values (y-axis) for averaged LD values by luthier correlated with mean year of luthier production. Circles, labels, and red indicate significant LD correlation with time. Note that LD1 (9.4% separation) is exceptionally correlated with time. C) Scatterplot showing correlation of averaged LD1 values for luthiers with average year of luthier violin production. rho and p values and indicated. All p values shown in this figure are multiple test adjusted across LDs to control false discovery rate (FDR) using the Benjamini-Hochberg (BH) method.

