Figure 3.

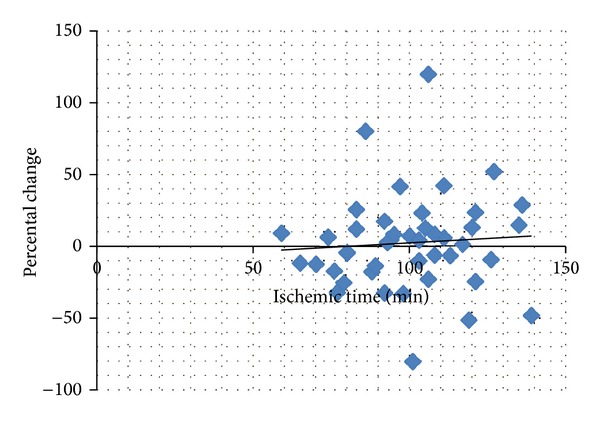
Correlation between percental change (blood sample at time points one and two) and ischemic time, exemplified by soluble P-selectin (all three groups). R 2 = 0.0048, ns.

Correlation between percental change (blood sample at time points one and two) and ischemic time, exemplified by soluble P-selectin (all three groups). R 2 = 0.0048, ns.