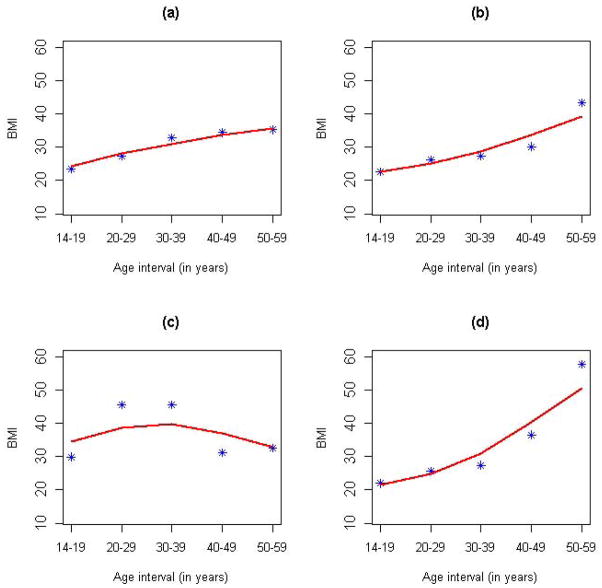
Figure 2. Observed versus PACE-predicted BMI profiles.
Panels (a) and (b) display the BMI profiles of two randomly selected individuals with asterisks and solid lines corresponding to observed and PACE-predicted BMI, respectively. Panel (c) shows an individual with the largest FPC3 score and the third smallest FPC2 score. Panel (d) shows an individual with the largest FPC2 score and the smallest FPC3 score.

