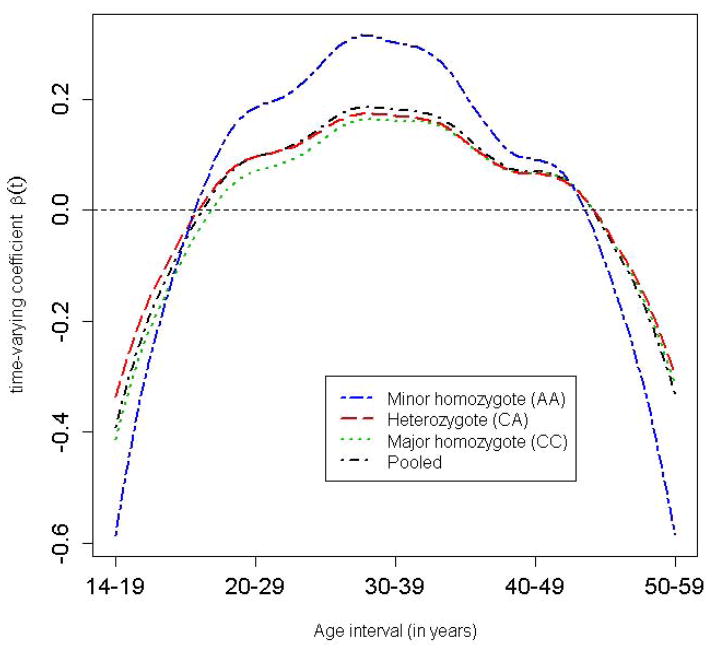
Figure 3. Genotype-specific time-varying coefficient for the longitudinal BMI.
The individual curves were obtained by fitting Model (7) stratified by the genotype of FTO SNP rs8050136 adjusted for age and gender, while the “pooled” curve was obtained by fitting Model (7) to all the individuals adjusted for age and gender.

