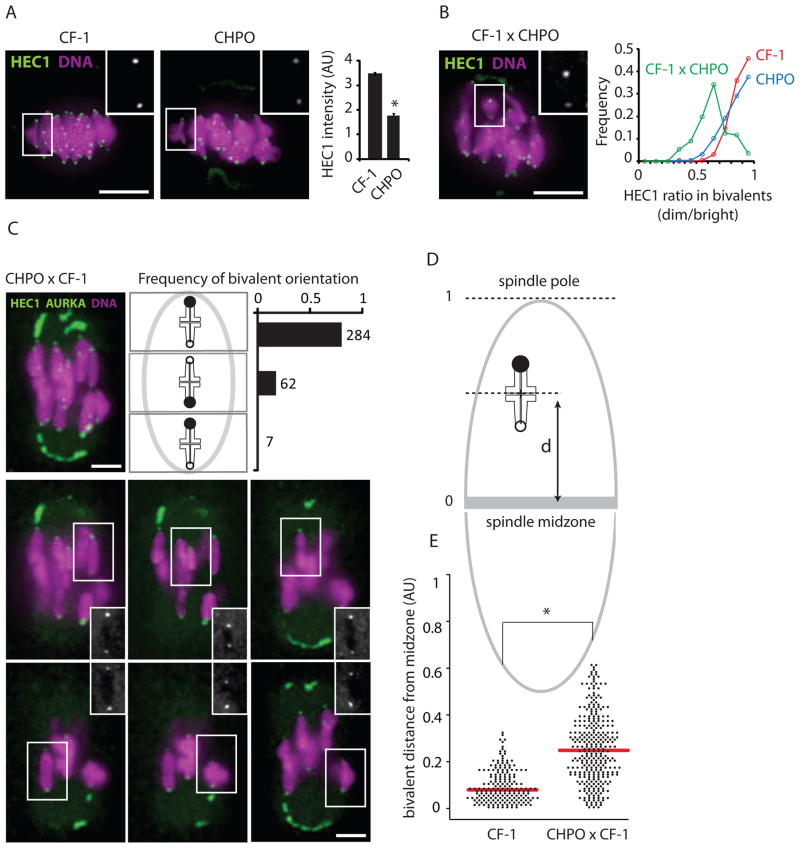
Figure 2. Differential centromere strength within telocentric bivalents affects their position at metaphase I.
(A) HEC1 staining per centromere was quantified in CF-1 (n=28) and CHPO (n=15) MI oocytes, AU: arbitrary units, error bars: SEM. (B) HEC1 staining in CF-1 x CHPO oocytes (n=28). Graph shows the binned distribution of HEC1 intensity ratios (dimmer/brighter kinetochore) calculated for each telocentric bivalent in CF-1 x CHPO oocytes (green, n=28), CF-1 oocytes (red, n=32) or CHPO oocytes (blue, n=30). (C) Images show AURKA, HEC1, and DNA staining in CF-1 x CHPO oocytes (n=64) at metaphase I: a maximal intensity z-projection including all chromosomes (1) and optical sections showing each telocentric bivalent individually (2–7). Schematic shows bivalent positions as equidistant between the two poles (middle), or off-center towards the stronger kinetochore (upper panel) or weaker kinetochore (lower panel). The proportion of bivalents in each group is plotted. (D and E) Schematic shows bivalent position measured as distance (d) from the spindle midzone. Positions of CF-1 and CF-1 x CHPO bivalents at metaphase I are plotted. Each point represents one bivalent; mean shown as red bar. Insets: HEC1 in individual bivalents; scale bars: 5 μm; asterisks: P<0.001.

