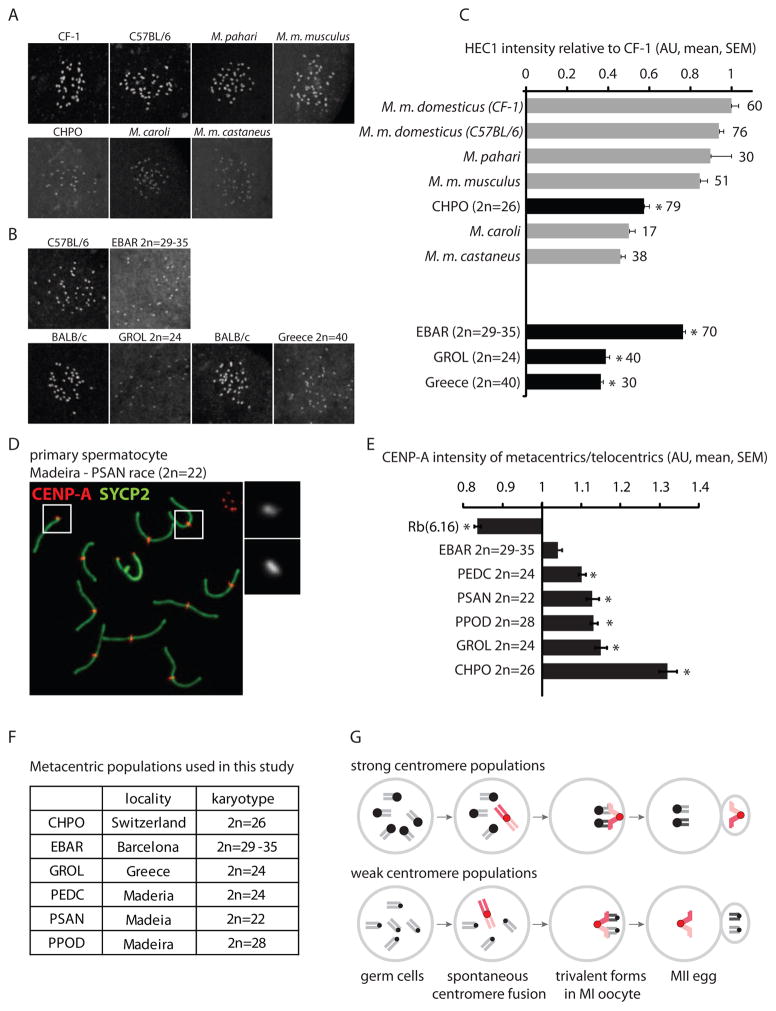
Figure 4. Relative centromere strength predicts meiotic drive in natural mouse populations with metacentrics.
(A and B) HEC1 staining in MI oocytes from commercially available mouse species, subspecies and strains (A) and from natural metacentric populations in Barcelona and Greece and a telocentric population in Greece, together with a standard laboratory strain for comparison (B). (C) HEC1 staining was quantified relative to laboratory mouse strains and normalized to CF-1. Numbers of oocytes in each group are indicated; gray bars: telocentric populations, black bars: metacentric populations; asterisks: statistically different from lab strains (P<0.05). (D and E) CENP-A staining was quantified in spermatocytes from CHPO, Rb(6.16), and natural metacentric populations. A representative image of a metacentric karyotype (D) is shown (PSAN, 2n=22); insets: telocentric (1) and metacentric (2) chromosomes. The ratio of CENP-A staining in metacentrics/telocentrics was calculated for each group (E). Asterisks: metacentrics statistically different from telocentrics (P<0.05). Scale bars: 5 μm; AU: arbitrary units. (F) Listing of the karyotypes of the natural metacentric populations used in this study. (G) Model for meiotic drive of Rb fusions. In populations with strong centromeres, fusions that arise spontaneously (red chromosomes) tend to have weaker centromeres than the homologous telocentrics and therefore preferentially segregate to the polar body. In populations with weak centromeres, fusions tend to be relatively strong and are preferentially retained in the egg.

