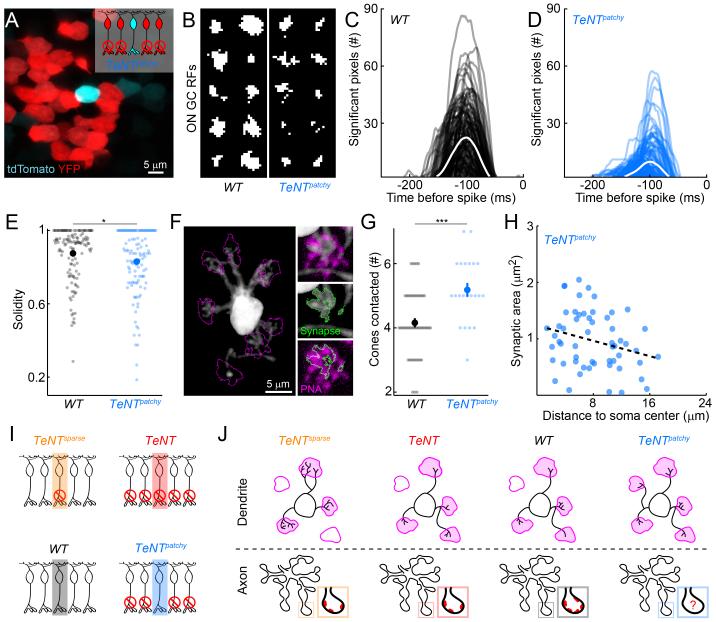
Figure 4.
Dendrites of active BCs with silenced neighbors expand to recruit more cones.
(A) Image of BC somata in a flat mounted TeNTpatchy retina showing a single tdTomato-positive YFP-negative B6 surrounded by TeNT-expressing (YFP-positive) neighbors. Inset schematic illustrates labeling (cyan: tdTomato, red: YFP) and activity status of the analyzed B6 cells (middle cell) and their neighbors. Red circles with diagonal crossings indicate axonal silencing by TeNT expression.
(B) Binarized RF center maps of 10 representative ON GCs recorded in WT (left panel) and TeNTpatchy (right panel) retinas. Spike-triggered averages (STAs) were constructed from GC responses to 1 h of Gaussian checkerboard white noise stimulation. Significant center pixels were defined as having higher intensity (ON GCs) at the temporal peak of the response than expected based on simulated STAs constructed by random placement of a similar number of spikes as the cell in question (s. Experimental Procedures).
(C, D) Plots of the temporal evolution of the number of significant ON pixels (i.e. significantly higher intensity than mean) of ON GCs indicate reduced RF center size but preserved response kinetics in TeNTpatchy (D, n = 130) compared to WT (C, n = 134) and retinas.
(E) Comparison of the solidity of ON GC RFs in WT (n = 134) and TeNTpatchy (n = 130) retinas. Solidity was defined as the ratio of the area of the sum of the significant pixels over the area of the smallest convex polygon encompassing them. Each small circle represents one ON GC. Large circles (errorbars) mark the population averages (± SEM).
(F) Projection through a confocal image stack of representative B6 dendrites in a TeNTpatchy retina. Insets show individual contacts of the B6 dendrite with cones stained with fluorescent PNA. Perimeters of cones and synaptic contacts are outlined in magenta and green, respectively.
(G) Comparison of the numbers of cones contacted by B6s in WT (n = 51) and TeNTpatchy (n = 22). Each small circle shows the number of cones contacted by one B6. Large circles (errorbars) represent the population averages (± SEM). The increase in the number of cones contacted by B6s in TeNTpatchy retinas is mediated by an expansion of their dendritic territories (WT: 137 ± 10 μm2, n = 20, TeNTpatchy: 197 ± 14 μm2, n = 15, p < 0.002).
(H) Scatter plot of the area of cone-B6 synaptic contacts as a function of distance from the center of the B6 soma. Each circle represents the contacts of one cone with a B6 dendrite (WT: 0.74 ± 0.05 μm2, n = 87, TeNTpatchy: 0.96 ± 0.07 μm2, n = 56, p < 0.01). The dashed black line indicates significant correlation (p < 0.02).
(I) Schematic illustrating the activity status of the analyzed B6 cells (shaded areas) and their neighbors in TeNTsparse, TeNT, WT and TeNTpatchy mice. Red circles with diagonal crossings indicate axonal silencing by TeNT expression.
(J) Schematic summarizing the changes in bipolar development observed in TeNTsparse, TeNT, WT and TeNTpatchy mice. Changes in dendritic structure and connectivity with cones (magenta) are depicted in the top row, while effects on axonal morphology and the numbers of synapses (red) are illustrated in the bottom row.
See also Figure S4.

