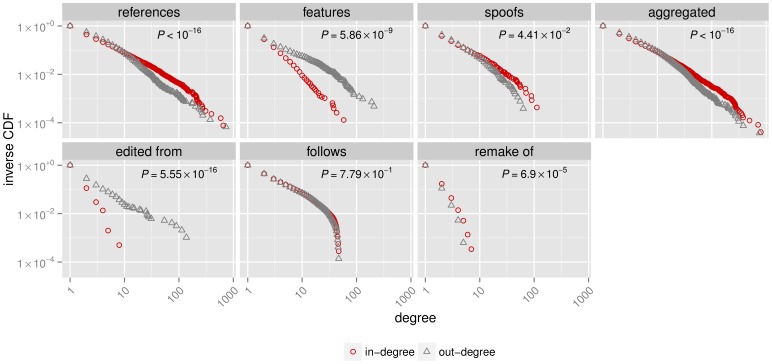
Figure 2. The inverse of the cumulative distribution function for the in- and out-degrees.
Plots are shown for the subnetworks constructed from the different citation types and the aggregated network. The P-values that result from a Kolmogorov-Smirnov test confirm for all but the follows subnetwork the significant difference between the in- and out-degree distributions.

