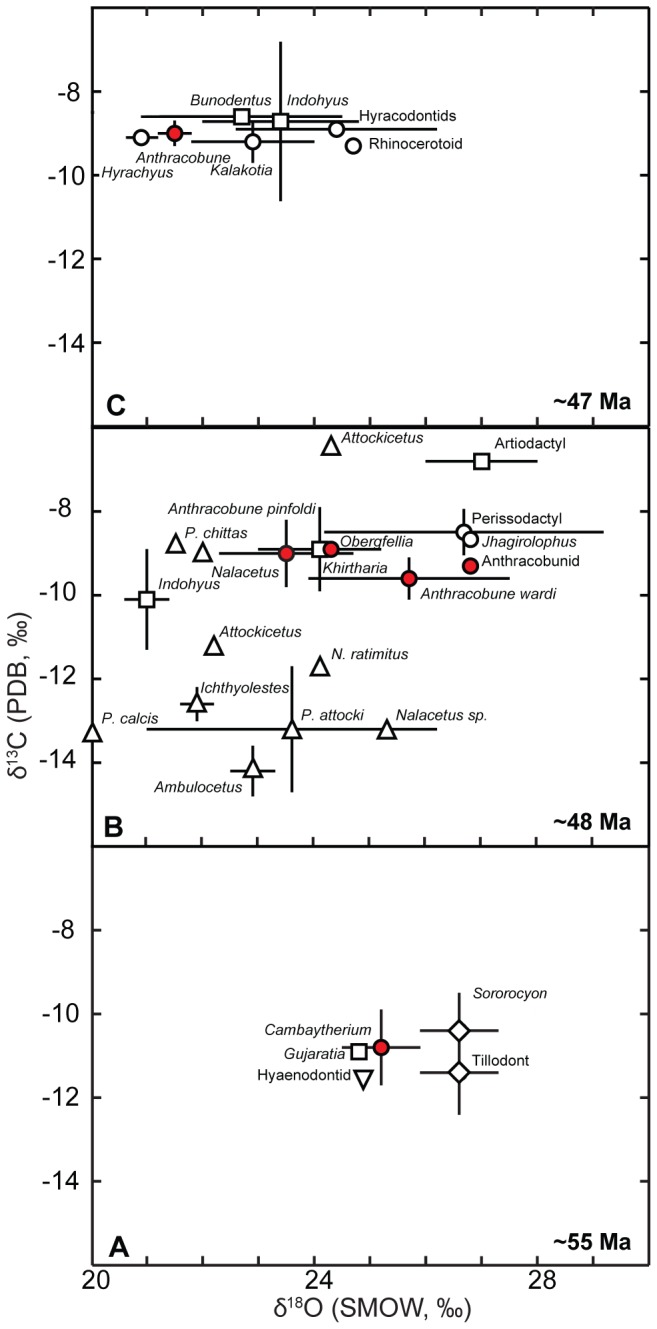
Figure 5. Bivariate plot of δ18O and δ13C values for enamel samples of early and middle Eocene mammals from India and Pakistan.

Results shown as mean ±S.D. for the sample populations. Data from (A) early Eocene and (B, C) middle Eocene taxa from India and Pakistan. Circles, perissodactyls; red circles, anthracobunids; squares, artiodactyls; triangles, cetaceans; inverse triangles, creodonts; diamonds, condylarths. See Suppl. Info. for details.
