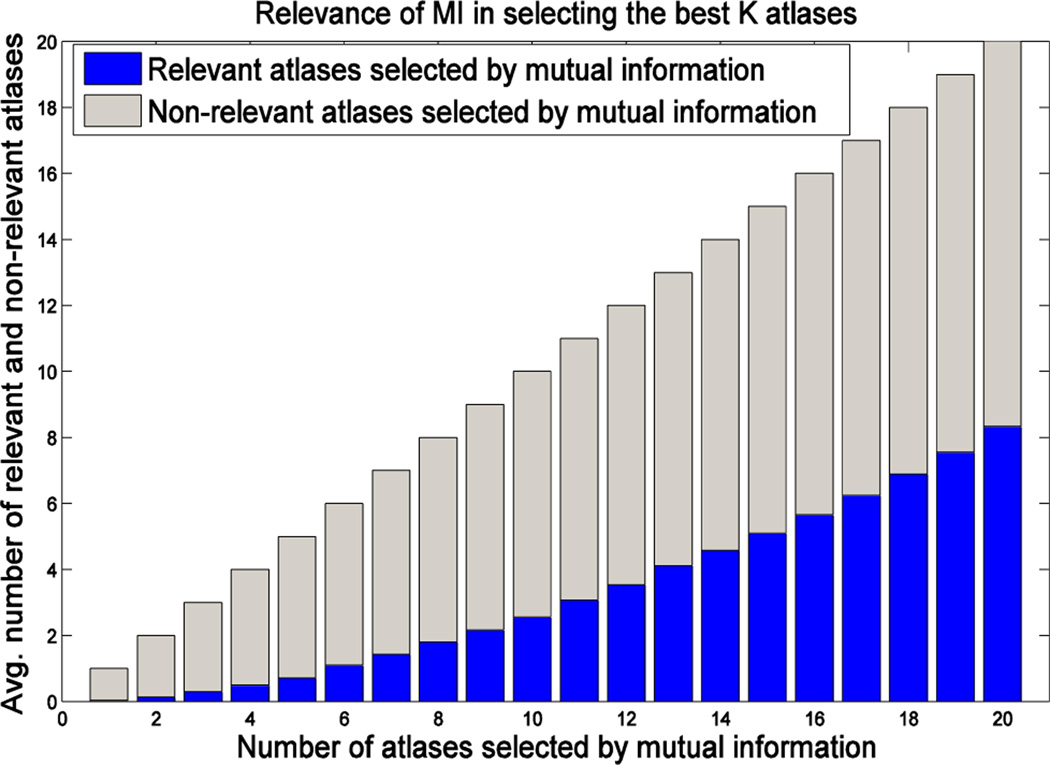
Fig. 1.
Number of relevant (blue) and non-relevant (gray) atlases selected by MI. Each bar shows the average results of 132 leave-one-out experiments in labeling the left and right hippocampi from 66 subjects. Specifically, at each leave-one-out experiment, we used one subject as the target subject and the remaining 65 as the atlases. We compute the MI between the ROIs (containing hippocampus) in the target image and each linearly-aligned atlas for selecting the top K atlases. Each selected atlas is considered relevant for labeling the target subject if it is included in the set of top K atlases with the highest label overlap ratio (Dice ratio) after non-linear warping to the target subject.

