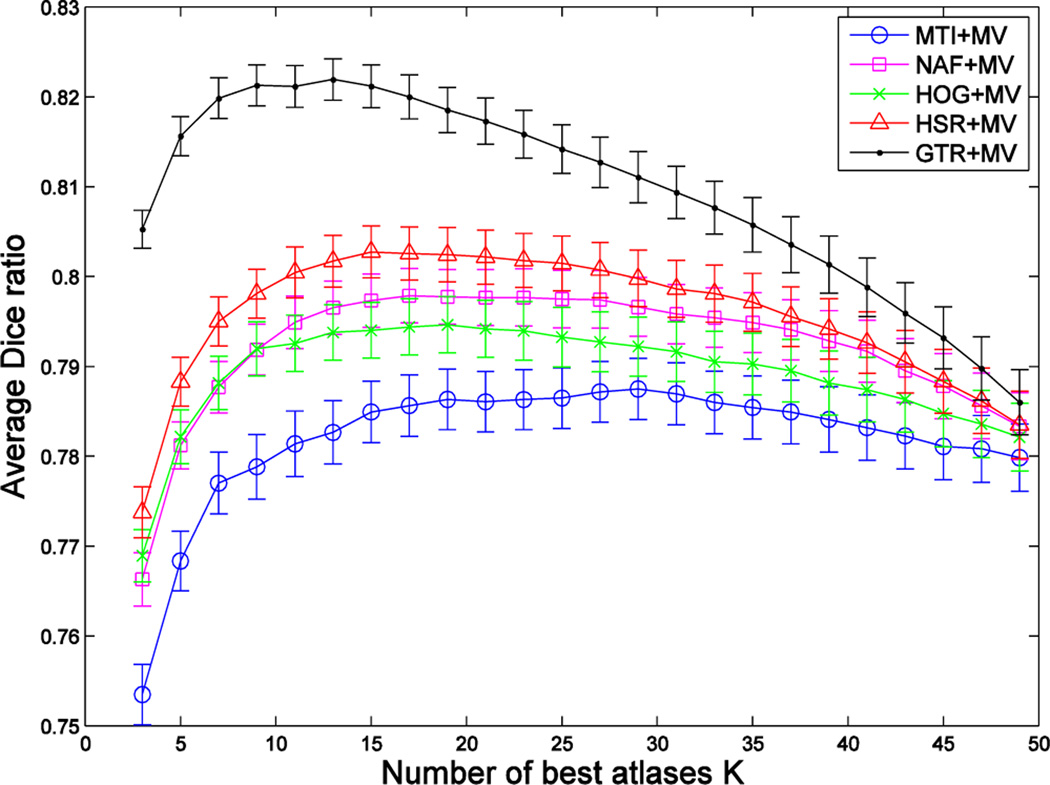
Fig. 6.
Blue, magenta, green, red and black curves show the segmentation performance achieved by combining MV-based label fusion with five different atlas selection methods (MI, NAF, HOG, HSR and GTR) on the ADNI dataset. Vertical axis shows the segmentation performance, and horizontal axis shows the number of atlases used. Results show the average segmentation performance on both hippocampi.

